How Do Facilities Calculate Process Cycle Efficiency?
Calculating process cycle efficiency begins with identifying those areas that do not contribute to the value of the product. This typically can be done using a value stream map, which identifies activities in a process that use resources, time, or space. Those activities are placed in one of three categories:
How Are Activities Classified as Value-Added vs. Non-Value-Added?
| Activity Type |
Description |
Lean Classification |
| Value-Added |
Activities the customer is willing to pay for because they directly improve the product |
Necessary and productive |
| Necessary but Non-Value-Added |
Required activities that do not directly add value from the customer’s perspective |
Waste (Type 1) |
| Non-Value-Added |
Activities that add no value and are not required |
Waste (Type 2) |
- Value-added activities: These add value to the product, meaning they add something the customer is willing to pay for. Always look at value from the viewpoint of the final customer. If the customer would not be willing to pay for an activity, then it is not a value adding activity. Accurately separating value-added operational steps from material delay times requires detailed process flow documentation. Conducting formal value stream mapping and process bottleneck identification highlights high-impact time traps where work-in-progress inventory stalls prior to final assembly.
- Necessary, but does not add value: These are activities that are necessary for producing the product, but do not add value a customer is willing to pay for. For example, I once had lunch in a tech company's cafeteria. Lunch is provided free, and that day featured lobster tails and baked salmon. A customer may not be willing to pay for your employees to have lobster tails for lunch every Wednesday, but you see it as necessary in order to hire and keep talented employees. Although you may consider these activities as necessary, since they do not add value, they are classified as waste.
- Non-value-added activities: These activities do not add anything of value to the final product. These activities are waste.
Understanding the Visual Science & Compliance Logic Behind Process Cycle Efficiency
In industrial manufacturing and material processing facilities, unorganized work cells and unlabelled inventory create unseen time traps where work-in-progress (WIP) sits idle up to 95 percent of total throughput time. The primary engineering cause of low Process Cycle Efficiency is not slow equipment operation, but rather non-value-added search time, excessive material handling, and visual ambiguity across processing zones.
When operators must search for tools, verify unlabelled chemical containers, or navigate cluttered walkways, human cognitive processing stalls. Under OSHA 29 CFR 1910.22 and ISO 9001:2015, implementing clear visual management acts as a physical fail-safe that reduces motion waste and eliminates decision fatigue.
Visual workplace controls—such as color-coded 5S floor marking tapes, standardized bin labels, and clear directional signs—reduce operator search time from minutes to under 200 milliseconds. By establishing a standardized visual layout, facilities directly reduce overall lead time, eliminate non-value-added waiting, and elevate Process Cycle Efficiency from standard baseline levels (5%–10%) to Lean benchmark standards exceeding 25 percent.
The Science of Seeing Waste: The Logic Behind PCE
Process Cycle Efficiency translates abstract waste into a quantifiable metric, making inefficiency tangible. The core principle is rooted in making process delays visible. When PCE is low, it signals that a significant portion of time is spent on non-value-added activities like waiting, transportation, or rework. By calculating PCE, teams can create a data-driven baseline for improvement. This focus on empirical data shifts the culture from "we think we're inefficient" to "we know we lose 85% of our time to waste, and here's where it happens."
Sustaining high cycle efficiency relies on clear, standardized visual cues across plant floor walkways and material storage zones. Applying standardized 5S floor marking tape color coding standards ensures operators instantly identify raw material staging, finished goods, and hazardous clearance zones.
There are two important questions: How Does Customer Perspective Define Process Waste Under Lean Rules? And what constitutes waste from the customer's perspective?
How Does Customer Perspective Define Process Waste Under Lean Rules?
Identifying who is a customer may not always be simple. For example, who are Google's customers? When you use Google to perform a search, are you the customer? No, you are the product Google sells. Google's business is selling advertising. What advertisers buy are clicks on their ads. Google uses its search service to attract people who will click on the ads. That makes you the product Google is selling, and their customers are those who are buying the ads.
What Are the 7 Wastes That PCE Helps Identify?
Waste is defined as being any of the following:
- Wait-time - idle time when nothing productive is being accomplished.
- Over-Production - producing more than is needed at any specific time.
- Transportation - moving material around without adding value.
- Over-Processing - doing additional work. For example, manufacturing to higher tolerances than the customer requires.
- Inventory - more raw materials, work in progress, or finished products in storage than is required.
- Motion - movement of people that does not add value.
- Defects - not meeting the specifications such that repair or rework is required in order to satisfy customers.
How Do Team Members Measure Process Cycle Time Across Value Stream Maps?
The next step is to determine the amount of time used by each activity on the Value Stream Map. This should equal the cycle time, which is the amount of time required to receive and process an order, through to the delivery of the product to the customer. A common way to calculate the cycle time is to take the total number of paid man-hours in a month, and divide that by the number of finished products produced that month. This gives the amount of time required to produce one item. That time is then divided among the activities on the value stream map.
What Is the Formula for Process Cycle Efficiency?
The calculation for Process Cycle Efficiency uses a simple formula:
- Process Cycle Efficiency = Value-Added Time / Cycle Time
If the process only includes activities that add value a customer is willing to pay for, then the process cycle efficiency is 100%. We like to think that our processes are close to 100% efficient. That the customer is willing to pay for everything we do in making the product they purchase. In reality the process cycle efficiency is typically in the 5% to 10% range. Once lean methods have been used to improve a process, the efficiency may improve to be in the range of 20-25%.
This means there is always room for improvement.
One of the important aspects of calculating the Process Cycle Efficiency is to establish a standard for how it will be calculated. To know if your Process Cycle Efficiency is improving, you need to be sure it is calculated the same way each time.
Process Cycle Efficiency is improved by decreasing the cycle time through the elimination non-value-added activities, and minimizing the necessary, but non-value adding activities. One of the tools for reducing cycle time is Quick Response Manufacturing (QRM). QRM puts the focus on reducing the time from order receipt to product delivery, by eliminating all unnecessary steps and activities.
Expert Field Note:
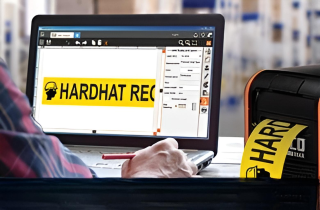
When executing 5S continuous improvement events to boost Process Cycle Efficiency, temporary paper labels and weak floor tapes fail under heavy forklift traffic and chemical washdowns. Under OSHA 29 CFR 1910.22, aisleways and work cells must remain clearly designated. Printing custom chemical-resistant bin labels and high-durability floor tags on-demand using the DuraLabel Bronco Max or Toro Max Labeling System ensures your 5S visual controls remain sharp, scannable, and permanent.
How Does 5S Improve Process Cycle Efficiency?
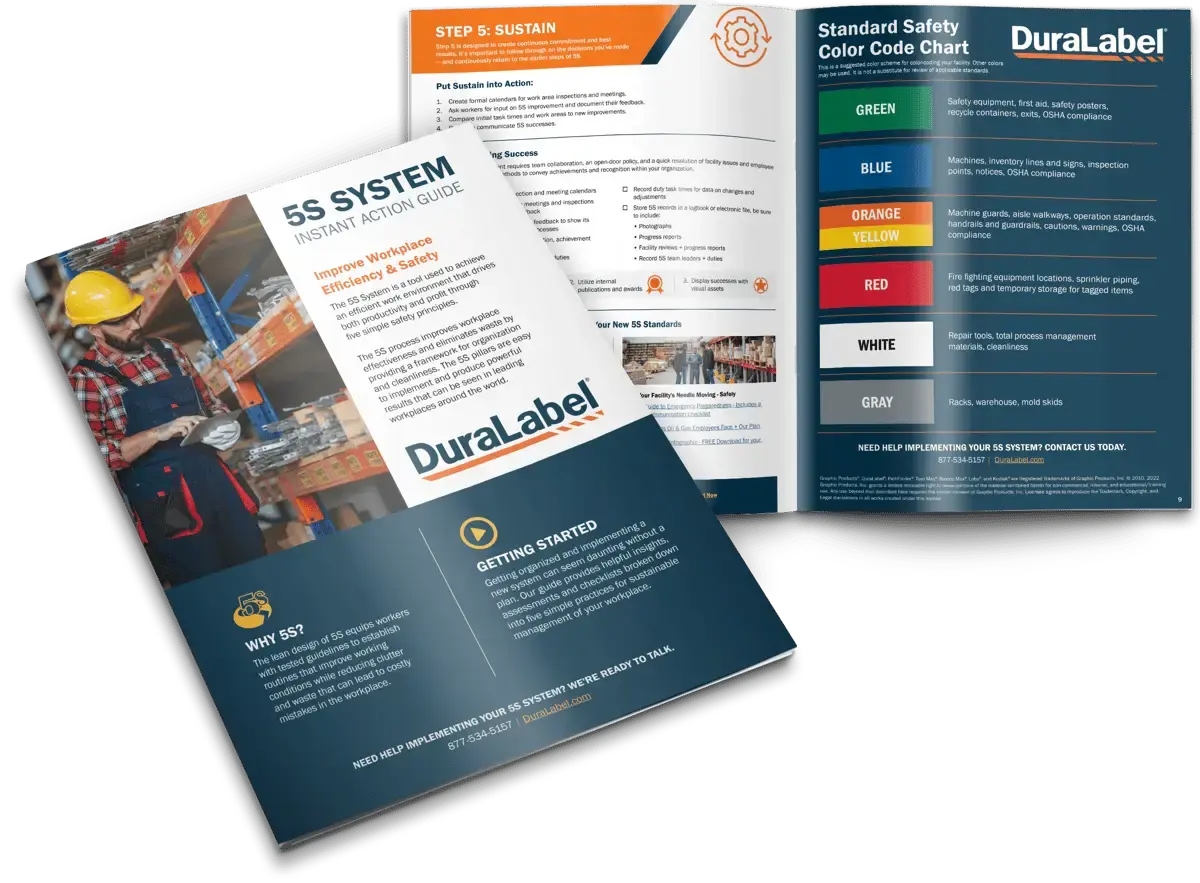
Seeing the activities involved in a process, and the amount of time they each require, is made a lot easier when the workplace is well organized. That's why 5S is one of the foundational principles of lean manufacturing. You can learn more about 5S, and how it can help your organization be more productive, with a 5S System Guide from Duralabel.
.png)