Deadliest & SAFEST Cities to Work In
Infographic Transcription
Workplace Deaths per 1,000,000
Map callouts (Workplace deaths per 1,000,000)
Mount Vernon, WA: 84.6
Portland, OR: 7
Sacramento, CA: 5.9
San Francisco, CA: 7.2
San Jose, CA: 7.5
Los Angeles, CA: 6.5
San Diego, CA: 7.3
Minneapolis, MN: 6.9
Milwaukee, WI: 7
Green Bay, WI: 32.3
Grand Rapids, MI: 23
Huntington, WV: 34.7
Tulsa, OK: 21.1
Midland, TX: 85.5
Beaumont, TX: 35.8
New Orleans: 30.2
Nashville, TN: 20.4
Anchorage, AK: 30.9
Boston, MA: 7.6
Providence, RI: 7.5
New York, NY: 7.6
SAFEST CITIES by workplace deaths per population in the U.S.
Columns: City | Workplace Fatalities | Population | Deaths Per 1,000,000
Sacramento-Arden-Arcade-Roseville, CA | 13 | 2,176,235 | 5.97
Los Angeles-Long Beach-Santa Ana, CA | 84 | 12,944,801 | 6.49
Minneapolis-St. Paul-Bloomington, MN-WI | 23 | 3,318,486 | 6.93
Milwaukee-Waukesha-West Allis, WI | 11 | 1,562,216 | 7.04
Portland-Vancouver-Beaverton, OR-WA | 16 | 2,262,605 | 7.07
San Francisco-Oakland-Fremont, CA | 32 | 4,391,037 | 7.29
San Diego-Carlsbad-San Marcos, CA | 23 | 3,140,069 | 7.32
8(t). Providence-New Bedford-Fall River, RI-MA | 12 | 1,600,224 | 7.50
8(t). San Jose-Sunnyvale-Santa Clara, CA | 14 | 1,865,450 | 7.50
Boston-Cambridge-Quincy, MA-NH | 35 | 4,591,112 | 7.62
New York-N. New Jersey-Long Island, NY-NJ-PA | 145 | 19,015,900 | 7.63
Top 10 Deadliest Jobs
(Source: U.S. Bureau of Labor)
Deaths a Year per 100,000 workers
Fishermen — 116.0
Logging Workers — 91.9
Airplane Pilots & Flight Engineers — 70.6
Farmers & Ranchers — 41.4
Mining Machine Operators — 38.7
Roofers — 32.4
Sanitation Workers — 29.8
Truck Drivers / Delivery Workers — 21.8
Industrial Machine Workers — 20.3
Police Officers — 18.0
Deadliest cities by workplace deaths per population in the U.S.
Columns: City | Workplace Fatalities | Population | Deaths Per 1,000,000
Midland, TX | 12 | 140,308 | 85.53
Mount Vernon-Anacortes, WA | 10 | 118,109 | 84.67
Beaumont-Port Arthur, TX | 14 | 390,535 | 35.85
Huntington-Ashland, WV-KY-OH | 10 | 287,599 | 34.77
Green Bay, WI | 10 | 309,469 | 32.31
Anchorage, AK | 12 | 387,516 | 30.97
New Orleans-Metairie-Kenner, LA | 36 | 1,191,089 | 30.22
Grand Rapids-Wyoming, MI | 18 | 779,604 | 23.09
Tulsa, OK | 20 | 946,962 | 21.12
Nashville-Davidson-Murfreesboro, TN | 33 | 1,617,142 | 20.41
Note: All numbers represent the listed cities Metropolitan Statistical Area.
Smaller cities built around specific industry tend to have more dangerous work environments
Midland, TX • Tulsa, OK
Beaumont, TX • Anchorage, AK
Industry: Oil
Mount Vernon, WA
Industry: Construction
Huntington, WV
Industry: Steel Plants
Green Bay, WI
Industry: Paper Mills
New Orleans, LA
Industry: Maritime
Grand Rapids, MI
Nashville, TN
Industry: Auto Manufacturing
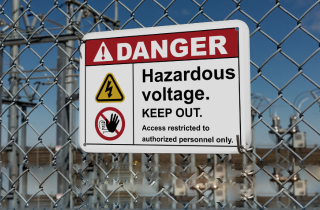
Make Your Workplace the SAFEST
Print Your Own Quality Safety Signs & Labels
Full Line of DuraLabel Printers
DuraLabel
Call now to learn more
888.973.2045
DuraLabel.com