Overall Equipment Effectiveness (OEE) is a foundational metric in Lean systems used to measure manufacturing efficiency. By tracking availability, performance, and quality, OEE helps identify bottlenecks and waste, enabling targeted improvements. Developed by Seiichi Nakajima, this Lean manufacturing term is also applicable to Six Sigma and 5S Methodologies, establishing a routine for evaluating the effectiveness of each step in the manufacturing process.
The sections below break down how OEE is calculated, what each component measures, how to interpret common OEE benchmarks, and how manufacturers use OEE to guide process improvements.
- The three factors of OEE: availability, performance, and quality
- The OEE formula explained step by step
- How to calculate availability
- How to calculate performance
- How to calculate quality
- What OEE percentage benchmarks mean
- Common causes of low OEE scores
- How OEE supports Lean and Total Productive Maintenance initiatives
Production inefficiencies rarely stem from a single issue. Understanding what OEE measures is the first step toward identifying performance gaps and making data-driven improvements.
Availability: How to Measure Downtime Loss
Availability considers Down Time Loss.
A= Operating Time / Planned Production Time
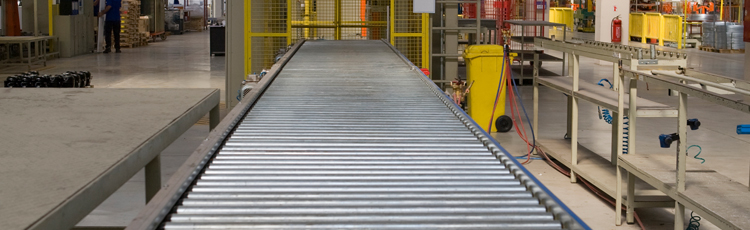
Example: A conveyor system is scheduled to run for two 8-hour (960 minute) shifts, with a 30-minute break per 8 hours.
Operating time = 900 min scheduled - 90 min unscheduled downtime = 810 minutes
Calculation: Availability = Operating time / Planned Production Time
Availability 810 minutes / 900 = 90%
Performance: Calculating Production Speed
Performance considers Speed Loss
P = Ideal Cycle Time / (Operating Time/Total Pieces)
Ideal Cycle Time is the minimum cycle time that your process can be expected to achieve in optimal circumstances. It is sometimes called Design Cycle Time, Theoretical Cycle Time or Nameplate Capacity.
Example: A conveyor system is scheduled to run for two 8-hour (960 minute) shifts, with a 30-minute break per 8 hours.
Operating time = 900 min scheduled - 90 min unscheduled downtime = 810 minutes
Parts are produced at the Standard Rate of 40 units/hour or 1.5 minutes per unit
The conveyor system produces 525 units during the total day. This is Total Units, not Good Units. Quality is not measured at this point.
Calculation: Performance = Ideal Cycle Time / (Operating Time of Total Pieces)
Time to produce parts = 525 * 1.5 minutes/unit = 787 minutes (Ideal Cycle Time)
Performance (Productivity) = 787 / 810 = 97%
Quality: Identifying Output Loss
Quality considers Quality Loss, and is calculated as:
Q = Good Pieces/ Total Pieces
Example: 525 units are produced. 56 are defective.
(525 units produced - 39 defective units) = 469 units
469 good units / 525 total units produced = 89%
Calculating OEE: Availability x Performance x Quality
OEE considers all three OEE Factors, and is calculated as:
OEE = Availability x Performance x Quality
*Calculation formula taken from www.oee.com. Examples are hypothetical.
Using OEE in Lean and Six Sigma Systems
Using OEE is not an absolute measure; it can break down in various areas. It's best used to identify problem areas that will take further analysis for key performance improvement. From manual, semi-automatic, to fully automatic operations or processes, implementing OEE tools as part of your lean manufacturing protocol will improve performance for any process in your workplace.
Take Action Today
Need help with OEE improvement strategies? Call us at 1-888-788-9936 to see how DuraLabel supports your efforts in measuring OEE in Lean environments using visual systems and Lean labeling tools.
Learn about our recommended best practices in the Kaizen and PDCA Best Practice Guide where we provide actionable advice on improving your organizations productivity and safety.