
In this day and age, businesses the world over are placing a premium on dependability. With so many interconnected systems and high-tech advances, organizations require dependable processes to ensure high productivity and keep customers happy.
But what steps can companies take to ensure dependability and plan for the occasional hiccup? Many tools, such as industrial label printers, strive to mistake-proof a process and reduce defects; however, the root cause of a fault must be identified, preferably before the fault happens. A common process for accomplishing this is Fault Tree Analysis (FTA).
What is Fault Tree Analysis and How Can Industrial Label Printers Help?
Fault Tree Analysis was introduced in 1962 by Bell Laboratories to examine system failures and understand the root causes. A typical system analysis starts with a potential fault, and works backward to identify possible contributing factors, using a visual presentation called a fault tree diagram. The risk tree follows a top-down approach, starting with the outcome (a potential fault condition), and evaluating the factors that could contribute to that fault.
Explained another way, the diagram helps companies understand and treat the cause of a problem, not the symptom.
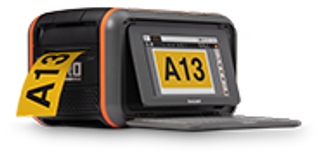
Industrial label printers play a crucial role in enhancing fault tree analysis by providing clear and precise labeling of system components, failure modes, and contributing factors. By accurately labeling each element within the fault tree diagram, industrial label printers like the DuraLabel Kodiak Max Industrial Sign and Label Print System ensure that all stakeholders have a comprehensive understanding of the system's structure and potential failure points. This clarity facilitates more effective problem-solving and risk mitigation strategies, ultimately leading to improved system reliability and safety.
Fault Tree Analysis Symbols
An event tree analysis uses a few basic symbols to outline various points, causes, and effects in a process. There are many symbols, but here are some of the basics to help you get started designing a fault tree diagram.
Circle: At its most basic, any item in a circle is a possible cause for the fault at the top of the diagram (or a fault in the AND gate, as explained below).
Logical gates:
- OR gate: Represented by an umbrella-shaped symbol with a curved lower edge, the OR gate means that, for a fault to occur (represented by the item above it), at least one of the items below signified by a circle must be true.
- AND gate: Represented by an umbrella-shaped symbol with a straight lower edge, the AND gate means that both conditions connected to the bottom of the AND gate must be true.
Fault Tree Analysis in Use
Let's look at an example of a basic system analysis: You flip a switch to turn on a light, but the light does not turn on. The fault condition is "light does not come on," so that's the beginning of the diagram (see Figure 1 below).
Next, what are the potential reasons the light didn't turn on?
- The light bulb is burned out.
- There has been a power failure.
- The switch is broken.
- One of the wiring connections has failed.
- The light bulb is not fully screwed in.
We'll start by adding these elements to a diagram. Figure 1 shows what this early fault tree might look like, with each possible cause for the fault represented by circles (numbered one through five).
Visual factories leverage these principles to optimize efficiency and safety on the shop floor, ensuring that processes are streamlined and potential hazards are minimized.
Figure 1 Fault Tree Using an OR Gate
.webp)
Each cause appears below the fault, with lines connecting them through an "umbrella" symbol with a curved lower edge. That symbol is called an OR gate; it signifies that, for the item above it (the fault) to occur, at least one of the causes must be true.
The next step is to examine each cause in more detail, to see if there might be multiple parts involved in those causes. For example, for there to be a power failure (cause #2), both of the following conditions must be met:
- The power to the building failed, and
- The light's backup battery failed.
Figure 2 adds these conditions to the fault tree.
Figure 2 Fault Tree Using an OR and an AND Gate
One of the circles has been replaced with an AND gate. For condition #2 (a power failure) to 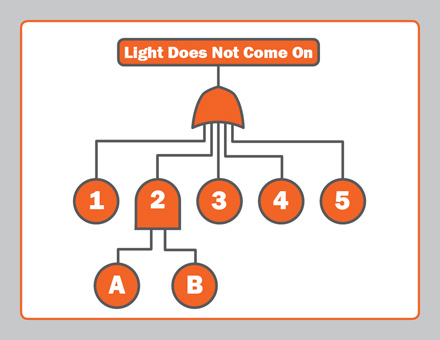 be true, all of the conditions connected at the bottom of that AND gate must be true. In this case, the power to the building must have failed (A), and the light's backup battery must also have failed (B).
From this point, we continue adding to the tree until there are no other contributing conditions. For instance, why would the backup battery fail? Keep asking "why?" to drill down to the potential root causes.
The OR and AND gates are called logical gates, and the symbols that represent these ideas are the same as those used on logic diagrams for other purposes, such as electrical circuit designs. Building a fault tree uses these logical tools to provide a systematic approach to understanding the root causes of a specific fault.
Uses of a Fault Tree Analysis to Increase Workplace Organization
The FTA is one of the most common problem-solving methods for better understanding reliability, dependability, and safety concerns in a given process. It lays out a system in a visual manner, shows the relationships between the steps in a process, and helps workers anticipate problems and their potential impacts. Incorporating risk tree analysis into a comprehensive jobsite safety plan can provide a structured approach to identifying and reducing potential hazards, ensuring a safer work environment for all personnel.
The diagrams can serve many uses in various industries, including the following:
Technical diagnostics: Diagrams can help find the root cause of software or hardware failure in office or technical settings. This can be as simple as understanding why a particular software update failed or as complicated as finding the root cause of a company-wide network failure.
Product development: If your company develops or builds new products, an FTA can create order while helping you understand why certain components don't work as expected. It allows you to sketch out the problem and work backward from there, giving you a clearer picture of the events that contribute to the expected action.
Safety: A fault tree diagram can assist in better understanding safety shortcomings in your facility. For example, if employees are slow to exit during a fire drill, performing a fault tree analysis can help the company's safety committee figure out where breakdowns are happening (whether due to inconvenient exits, a lack of egress maps, malfunctioning fire alarms, or bottlenecking). Companies can then use that information to improve their strategies in case a fire does occur.
The Next Step in Fault Tree Analysis
A fault tree diagram helps identify the root causes of a failure by showing the relationships among faults and their causes within a system. It is particularly useful in identifying sets of minor problems that could combine to cause a larger fault. Conducting an FTA brings these relationships to light.
Once a diagram is created, critical components within the system can be identified. This reduces the chance of failure because these critical components can be altered or eliminated.
In addition, the probability of failure can be evaluated. Using quantitative reliability information, and maintainability data (such as repair rates, failure rates, and the failure probability of components) estimates of the probability of failure can be calculated.
Fault Tree Analysis Resources
Fault tree diagrams are a popular lean manufacturing Six Sigma tool, owing to their focus on solving problems and improving processes. Whether you need safety signs, pipe markers, or equipment labels—Toro Max and Kodiak Max are ready to transport anywhere you are. Get help crafting a system that will provide the safety communication you need. Call 1-888-789-5952 and one of our experts will guide you through the process.
DuraLabel's free Electrical Safety Instant Action Guide helps deploy visual communication while ensuring OSHA and NFPA compliance. All of which are designed to reduce electrical incidents. Get your copy of Electrical Safety Instant Action Guide today.
Learn more about Six Sigma and other lean manufacturing tools that can help your facility boost its bottom line, increase production, and simplify processes in our lean manufacturing resource center. The hub includes free guides, tutorials, articles, infographics, and more.
Read Next:


DMADV Methodology: Design for Six Sigma Explained
What Is DMADV and How Does It Guide Process Design in Six Sigma? TheDMADV methodologyis a structured approach ...
Read
DFSS (Design For Six Sigma): A Customer Centered Process
What Is Design for Six Sigma and How Does It Improve Product Design? Design for Six Sigma (DFSS) is a ...
Read
Six Sigma Principles: Exploring Six Sigma, Lean, and The 5S System
Six Sigma is a systematic, data-driven methodology designed to eliminate defects and reduce variability in ...
ReadTake Action

Print Your Own Signs

Free Label Design Software
.webp)